
Your Power Curve page shows your projected and actual power capabilities across different durations, plus tools for verifying your Fitness Signature and comparing performance across gradients.
Access it at www.xertonline.com/calculator. This article covers what each element of the page shows and how to use the Calculator and Relative Power features.
What the Power Curve Shows
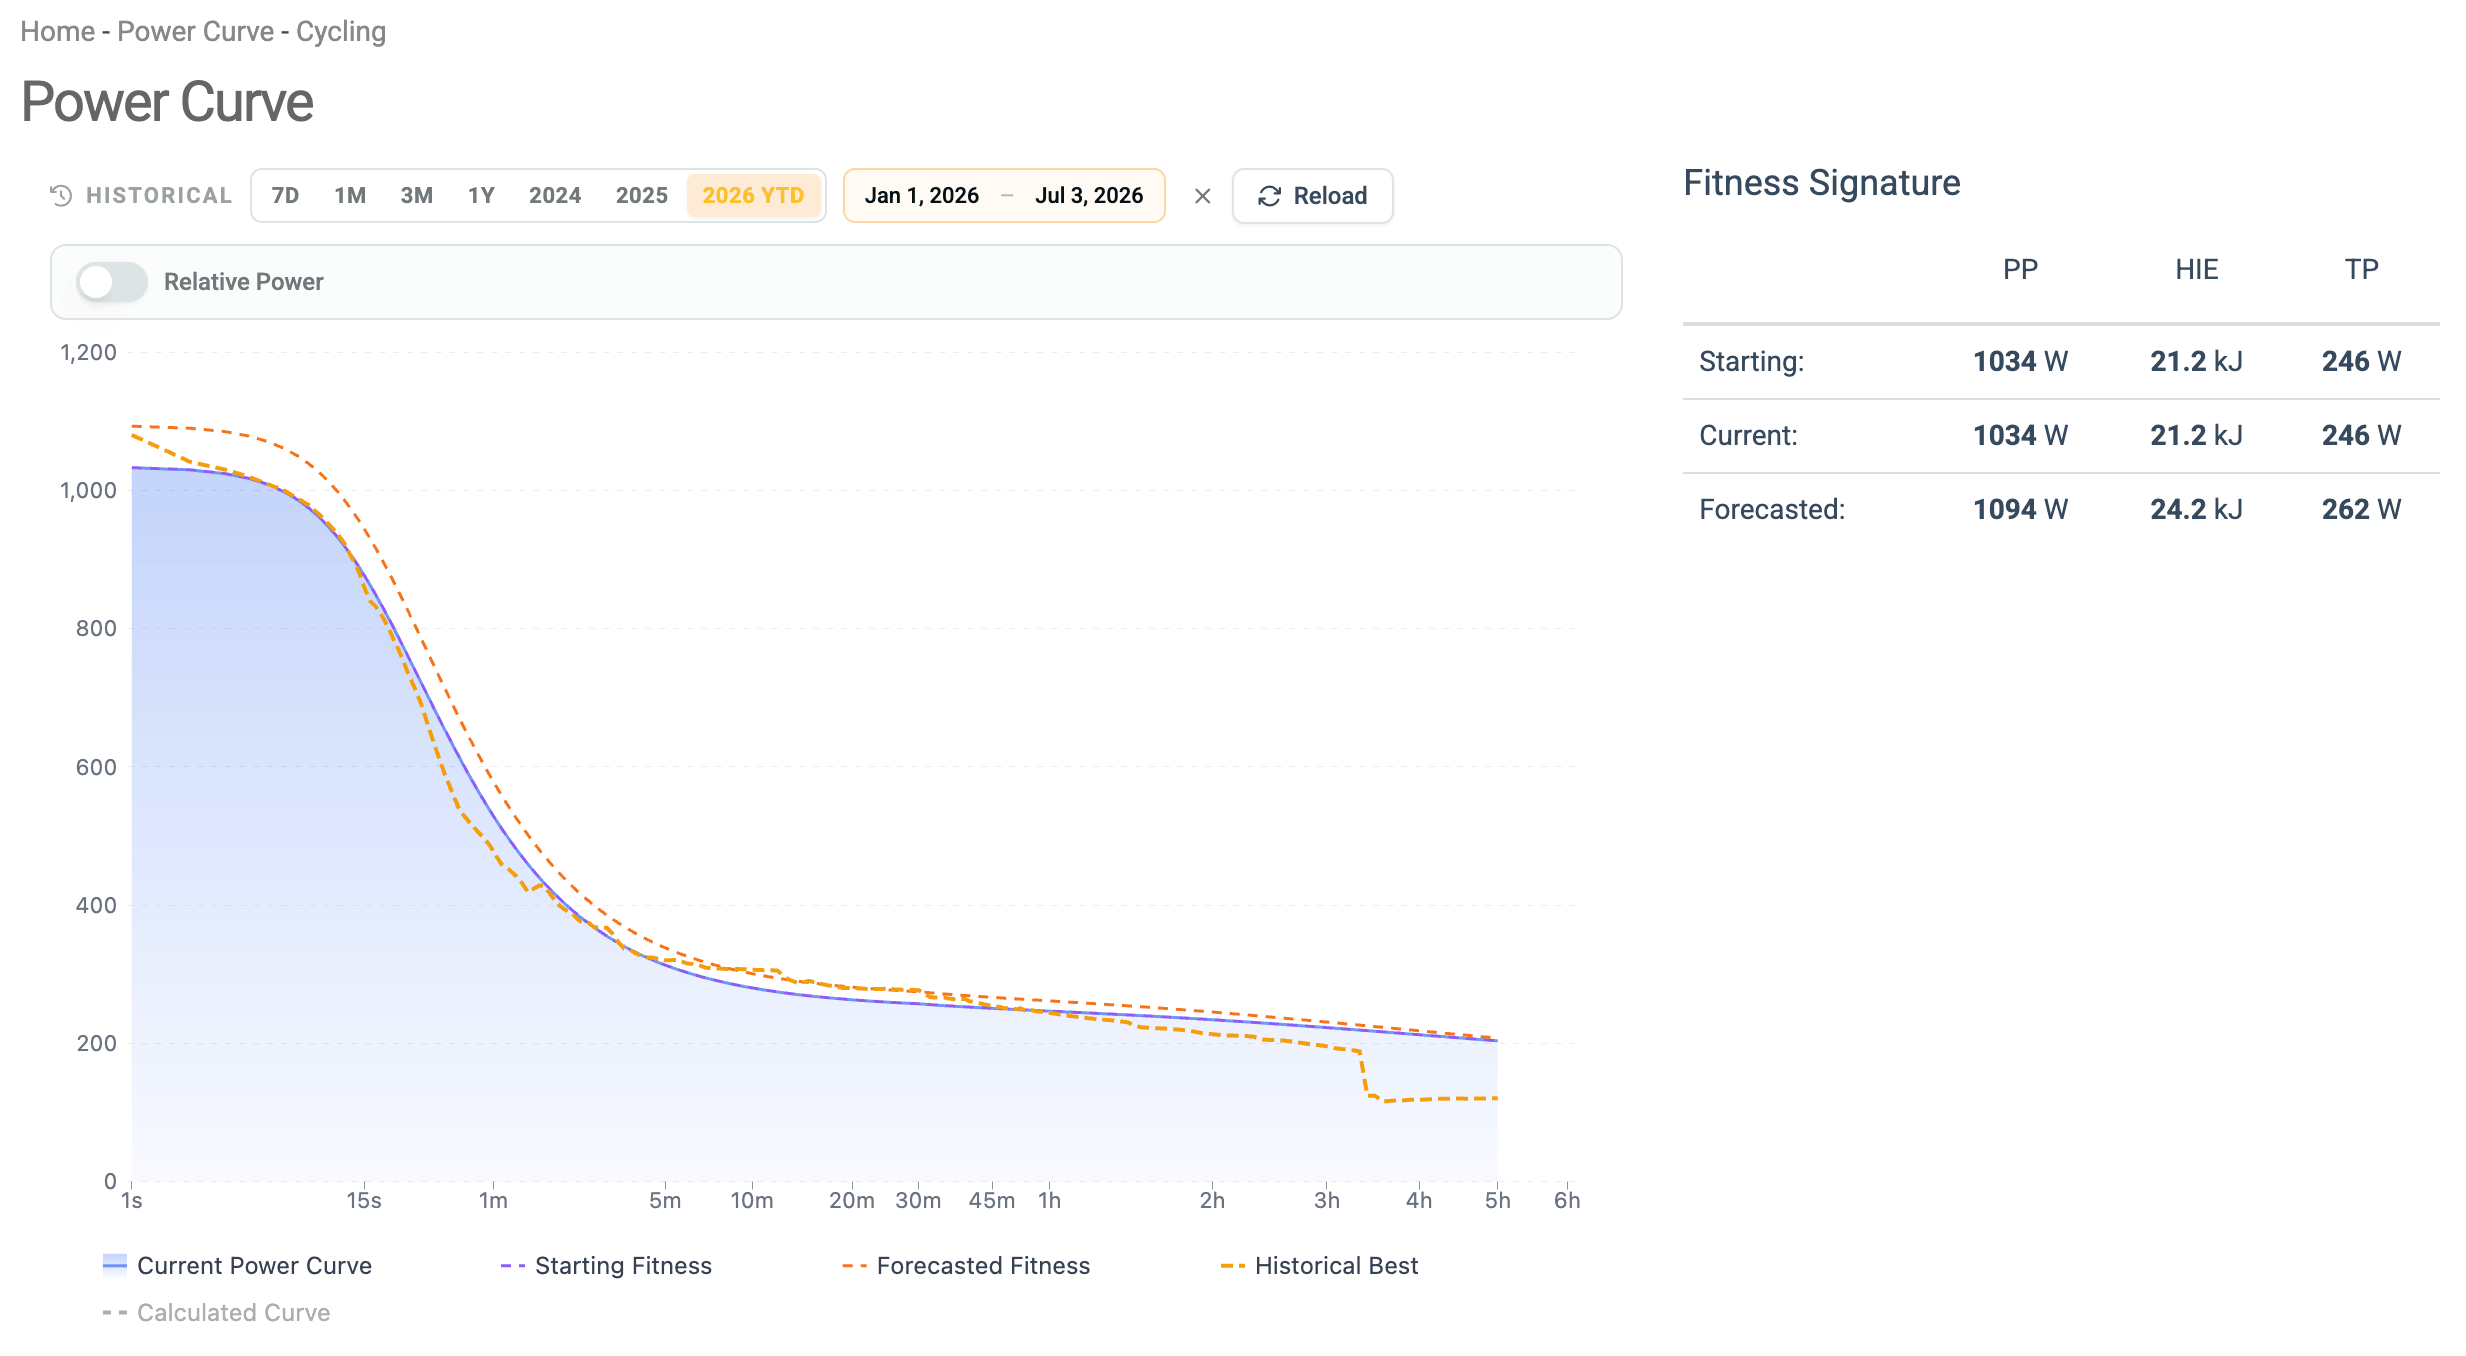
The Power Curve displays your power capabilities across durations from very short (seconds) to very long (hours). Several curves layers can be displayed on the chart at once:
Current Power Curve
Shows the power output your current Fitness Signature (TP, HIE, PP) predicts across each duration. This is Xert's model of your current capabilities.
Your Current curve is derived from your signature — it's a projection, not a record of your actual efforts.
Starting & Forecasted Power Curves
Available when you have an active Forecast AI plan. Two additional curves appear:
- Starting curve — your power curve at the start of your training plan
- Forecasted curve — your predicted capabilities at the end of your plan, based on the training XFAI has scheduled for your
Comparing the two shows you how your XFAI training plan changes your power curve.
Historical Best
Shows your Mean Maximal Power (MMP) — the highest power you've actually produced during your rides over the selected time window.
Use the time selector to choose the window: 7D, 1M, 3M, 1Y, or YTD. Click Load to update the chart.
Common observation: Your Current curve is often slightly higher than your Historical Best. This is expected — Xert's model predicts what your signature says you can do, and most riders don't produce maximal efforts at every duration during regular training. For more, see Why Is My Xert Power Curve Higher Than My Recorded Bests?
The Calculator
The Calculator estimates your Fitness Signature (TP, HIE, PP) from power values you provide. Use it to verify your current signature or to establish a starting signature from data outside Xert (Strava, Garmin Connect, TrainingPeaks, etc.).
For best results, use three power values across different durations:
- One short-duration effort (1-30 seconds) — near your max power
- One intermediate effort (2-5 minutes)
- One longer effort (8-30 minutes)
Enter your values and the Calculator estimates the signature parameters that best fit those durations.
What to do with the result:
- If the estimate closely matches your current Xert signature, your signature is likely accurate
- If the estimate is meaningfully different, your signature may be out of date — consider getting a breakthrough or, if you have strong external data, manually adjusting an activity's signature (see Manually Editing Your Signature on an Activity)
A note: The Calculator is a useful sanity check, but it's not a substitute for actual ride data. Xert's signature extraction from real rides considers more than just three points... it uses all your power data over time. Use the Calculator for verification, not as the primary source of your signature.
Relative Power Curve
Enable Relative Power to convert your Power Curve into a Relative Power Curve using Xert Relative Power (XRP). XRP weight-normalizes power so you can compare efforts between riders — or between your own rides at different weights and gradients — more fairly.
What Relative Power Does
The Relative Power view estimates how much power a 75 kg reference rider would need to produce to match your performance under the same conditions (equipment, aerodynamics, etc.).
Because the relationship between raw power and effective performance changes with gradient:
- On flat terrain (~0% gradient), raw power dominates — aerodynamic drag is the biggest resistance, and weight matters less
- On steep gradients (5%+), power-to-weight dominates — gravity becomes the biggest resistance, and weight matters much more
- On mixed terrain (1-4%), both factors contribute
Relative Power accounts for both effects across all grades.
Using the Gradient Slider
Adjust the gradient slider to match the terrain you're analyzing. Practical guidance:
- Flat time trial or crit: Set gradient to 0-1%
- Rolling terrain or road race: Try 2-4%
- Climbing focus: Set 5-10% depending on the climb
- Descent analysis: Move into negative gradients (down to -3%)
As you adjust the gradient, your Relative Power curve shifts — showing how competitive your power output is at each duration for that specific gradient.
Reading the Result
- Lighter rider on a steep gradient: Your Relative Power curve typically shifts upward. A 60 kg rider producing 300 W on a climb is doing more relative work than a 90 kg rider producing 300 W.
- Heavier rider on a steep gradient: Your Relative Power curve typically shifts downward. Weight becomes a disadvantage on climbs.
- On descents (negative gradients): The heavier rider's curve shifts upward — weight helps on descents.
This lets you understand where in the terrain range you're most competitive relative to other riders.
For a deeper explanation of XRP and the calculations behind it, see Xert Relative Power (XRP)
Related Articles
- How to Verify Your Fitness Signature — and what to do if it seems wrong
- Manually Editing Your Signature on an Activity
- Why Is My Xert Power Curve Higher Than My Recorded Bests?
- Xert Relative Power (XRP)
- How Xert Learns Your Fitness Signature
Need Help?
If your Current Power Curve seems off, the Calculator returns unexpected results, or you're not sure how to interpret the Relative Power view for your specific situation, contact support@xertonline.com.
Comments
0 comments
Please sign in to leave a comment.