
Xert’s Power Duration Curve displays your theoretical maximum average power based on your Fitness Signature, assuming you start fresh and ride steadily to failure. Real-world ride data often falls short due to fatigue, pacing, and variable conditions, so the curve typically exceeds your recorded bests unless you perform controlled, maximal efforts.
Short Answer
Xert’s Power Duration Curve shows your theoretical maximum average power, not just what you’ve happened to record in past rides.
It represents what you could produce under ideal conditions - not necessarily what you have produced in real-world riding.
Why This Happens
Xert calculates your Power Duration Curve from your Fitness Signature (TP, HIE, and PP).
The curve assumes that for any point on the curve:
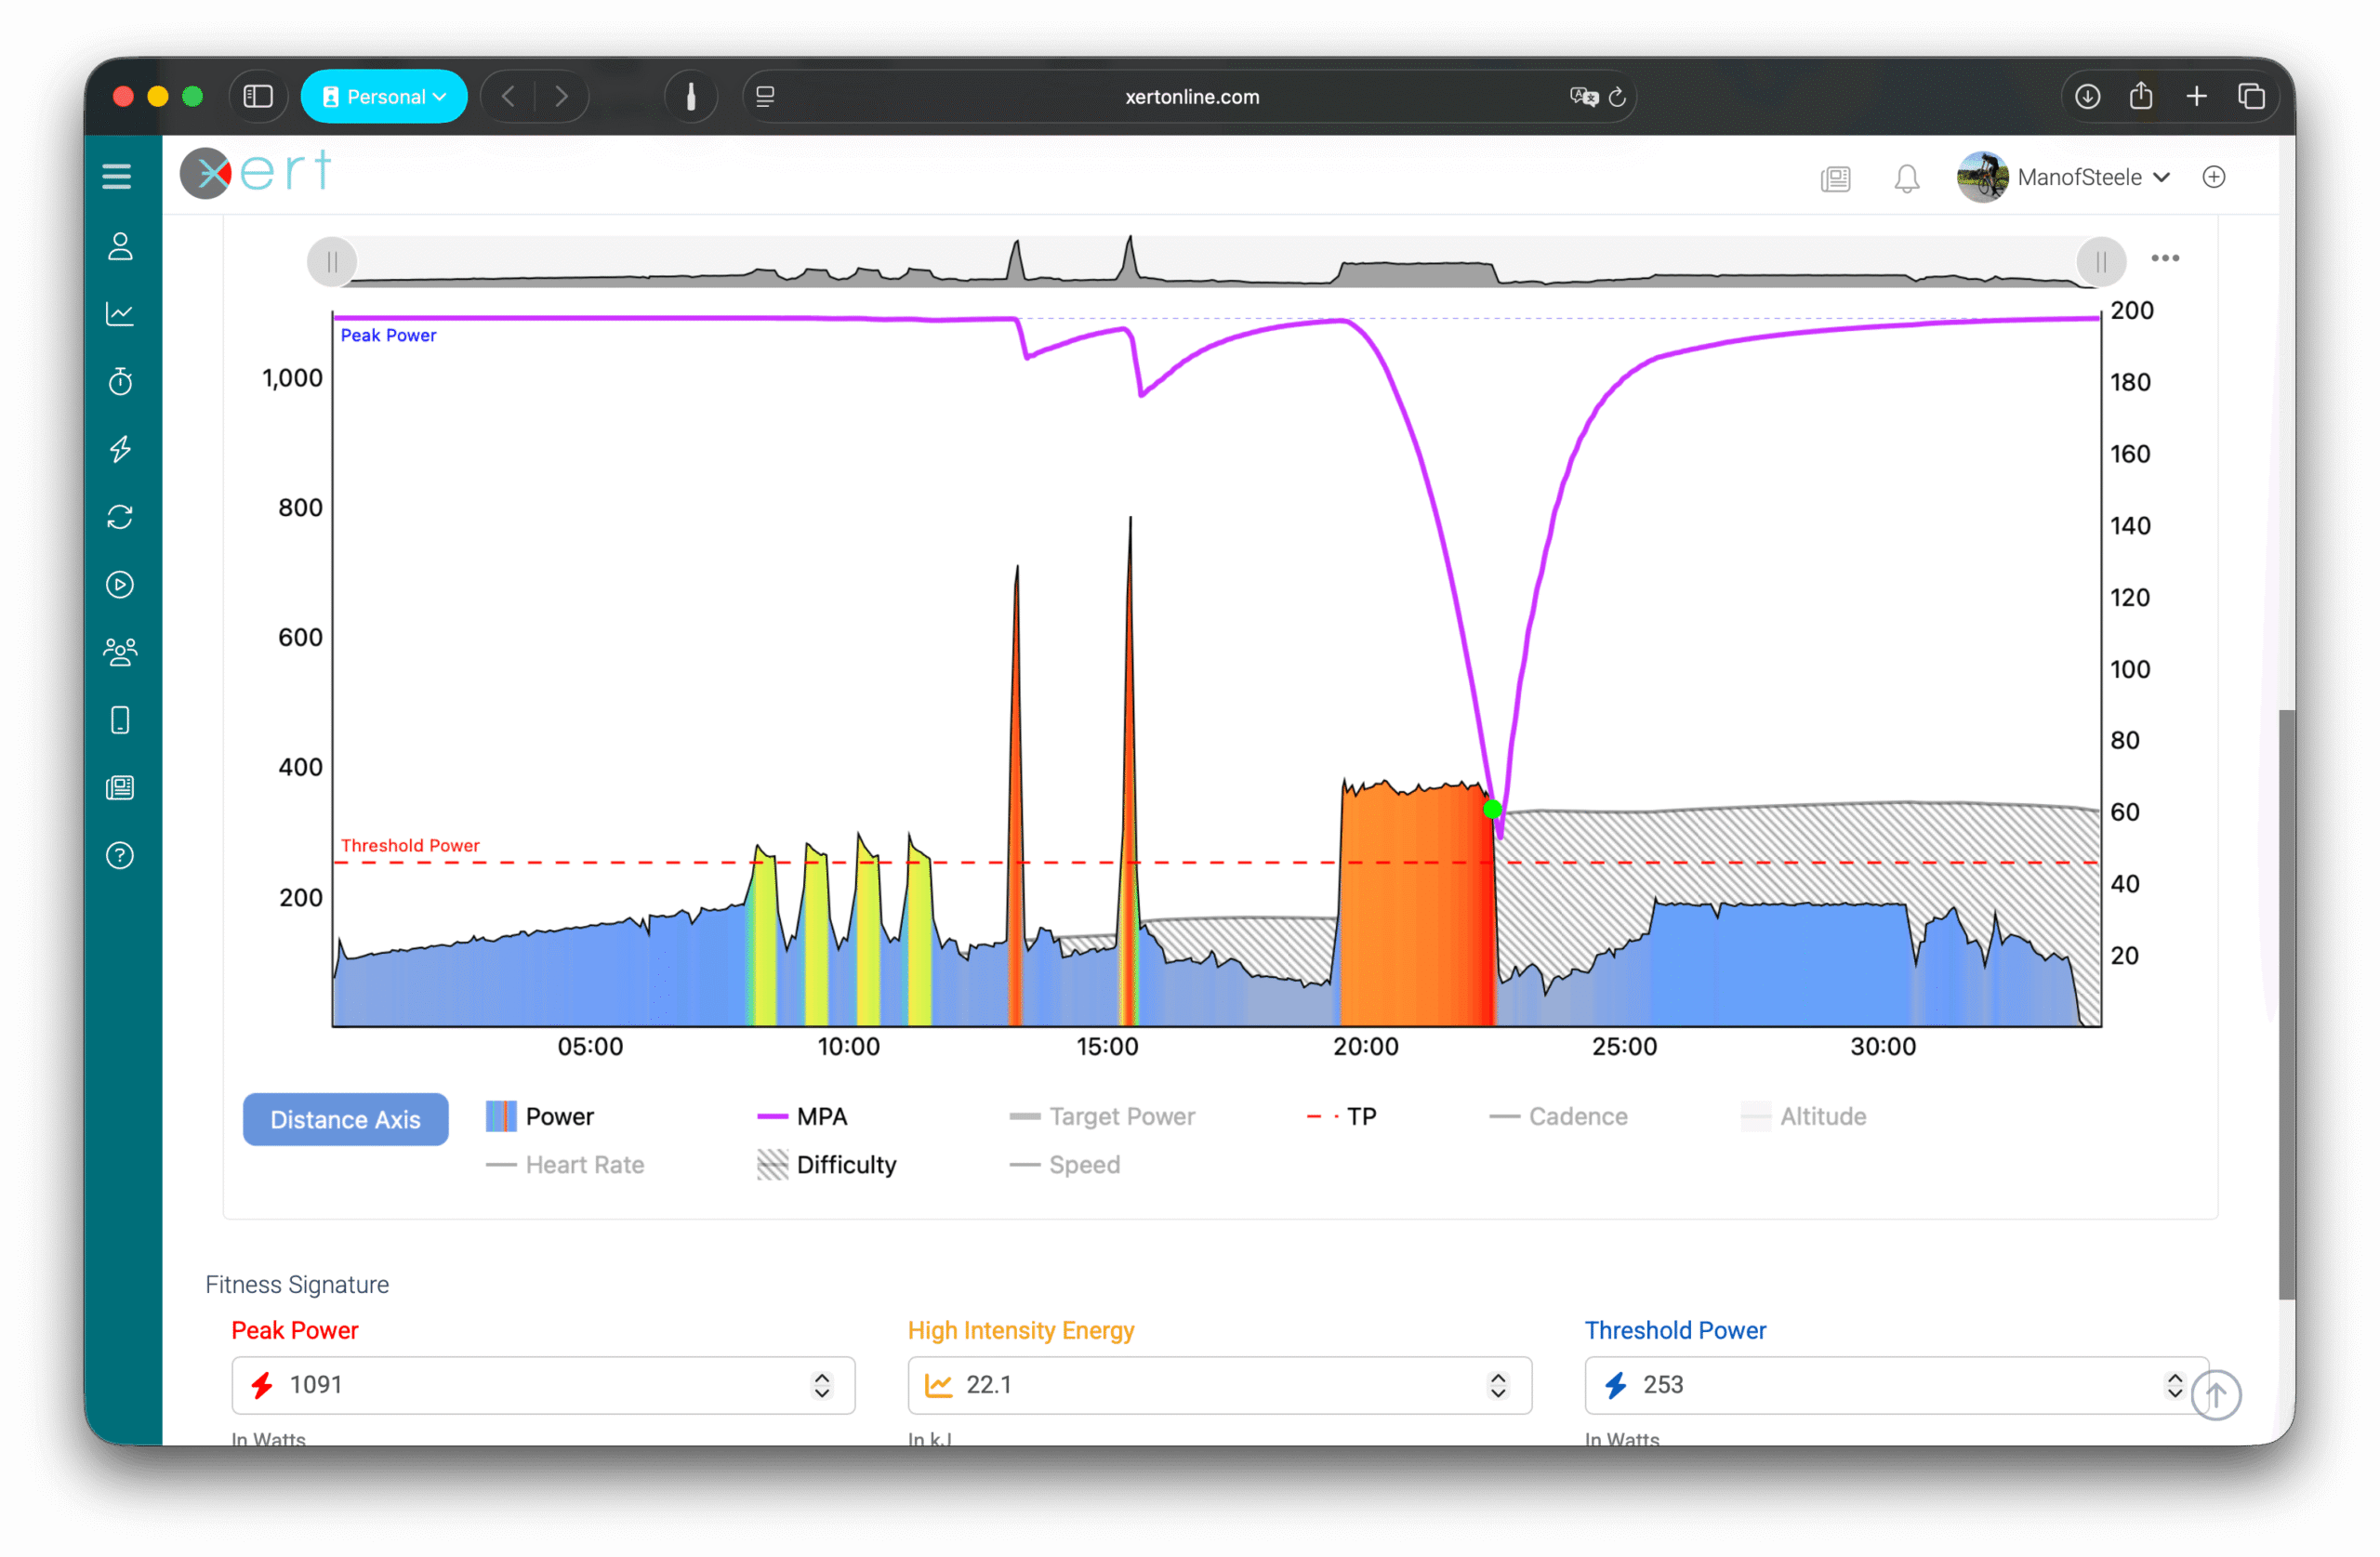
- You start fully fresh/recovered (e.g. your MPA is equal to your Peak Power when you begin the effort)
- You ride at a constant power & continue until failure (e.g. your MPA comes all the way down to whatever steady power you're outputting for that duration... "Breakthrough" at the conclusion of your effort)
- You have perfect pacing, gearing, and preparation
Under those assumptions, the curve shows the maximum average power you could sustain for any given duration, specifically above threshold.
Why Your Ride Data Doesn’t Look Like That
In real-world riding, power is rarely steady. You surge and recover. You climb harder and descend easier. You draft, coast, and reposition - especially in races. Even during a time trial, terrain and pacing cause natural fluctuations in power.
On top of that, many hard efforts outdoors or in race settings are performed with pre-existing fatigue. You may attempt a strong, steady effort, but if you’ve already accumulated fatigue from previous efforts, so your ability to generate maximum possible power is reduced. Looking at average power alone doesn’t account for this fatigue effect.
To exactly match a point on the Xert Power Curve, you would need to:
- Start fully fresh
- Hold the predicted power perfectly steady
- Ride until your MPA declines to your target duration power
- Finish at failure (a Breakthrough)
This seldomly happens organically in your ride data unless you're deliberately performing tests to exhaustion.
When Would Data Match the Curve?
The only time you’d see your actual historical bests align with Xert's Power Curve is if you intentionally performed constant-power efforts to failure for each duration.
For example:
- Holding your predicted 5-minute power for exactly 5 minutes
- Starting fresh (MPA fully replenished)
- Finishing in a Breakthrough
These types of efforts are not required when training with Xert, since the system models them mathematically.
Is This a Problem?
No - this is normal. It’s very common for Xert’s curve to be higher than your recent bests, especially if you haven't done a true fresh to failure test to exhaustion at that point on your power duration curve recently.
When Should You Be Concerned?
You may want to review your Fitness Signature if:
- The curve appears dramatically unrealistic, and/or
- You suspect your signature is outdated
Review your past couple of Breakthrough activities and search for large or unexplained increases to your fitness signature & flag activities if necessary. Feel free to reach out to Xert's support team for some assistance with reviewing your data, if needed.
Comments
0 comments
Please sign in to leave a comment.