
The Power Curve, or Power-Duration Curve (PDC), models the maximum average power you can sustain for various durations, assuming a fresh start and steady effort until failure. Xert calculates this using your Fitness Signature and MPA, offering a theoretical rather than historical bests-based curve, reflecting your combined energy systems.
Definition
The Power Curve - also called the Power-Duration Curve (PDC) - describes the relationship between the power you can produce and how long you can sustain it. It represents your maximum average power across different durations, assuming you start fresh, ride at steady power, and continue until failure.
The point where you can no longer sustain that power is called the point of failure.
What It Represents
The Power Curve answers a simple question: "How much power can I sustain for a given amount of time?"
Short durations correspond to higher power. Long durations correspond to lower power.
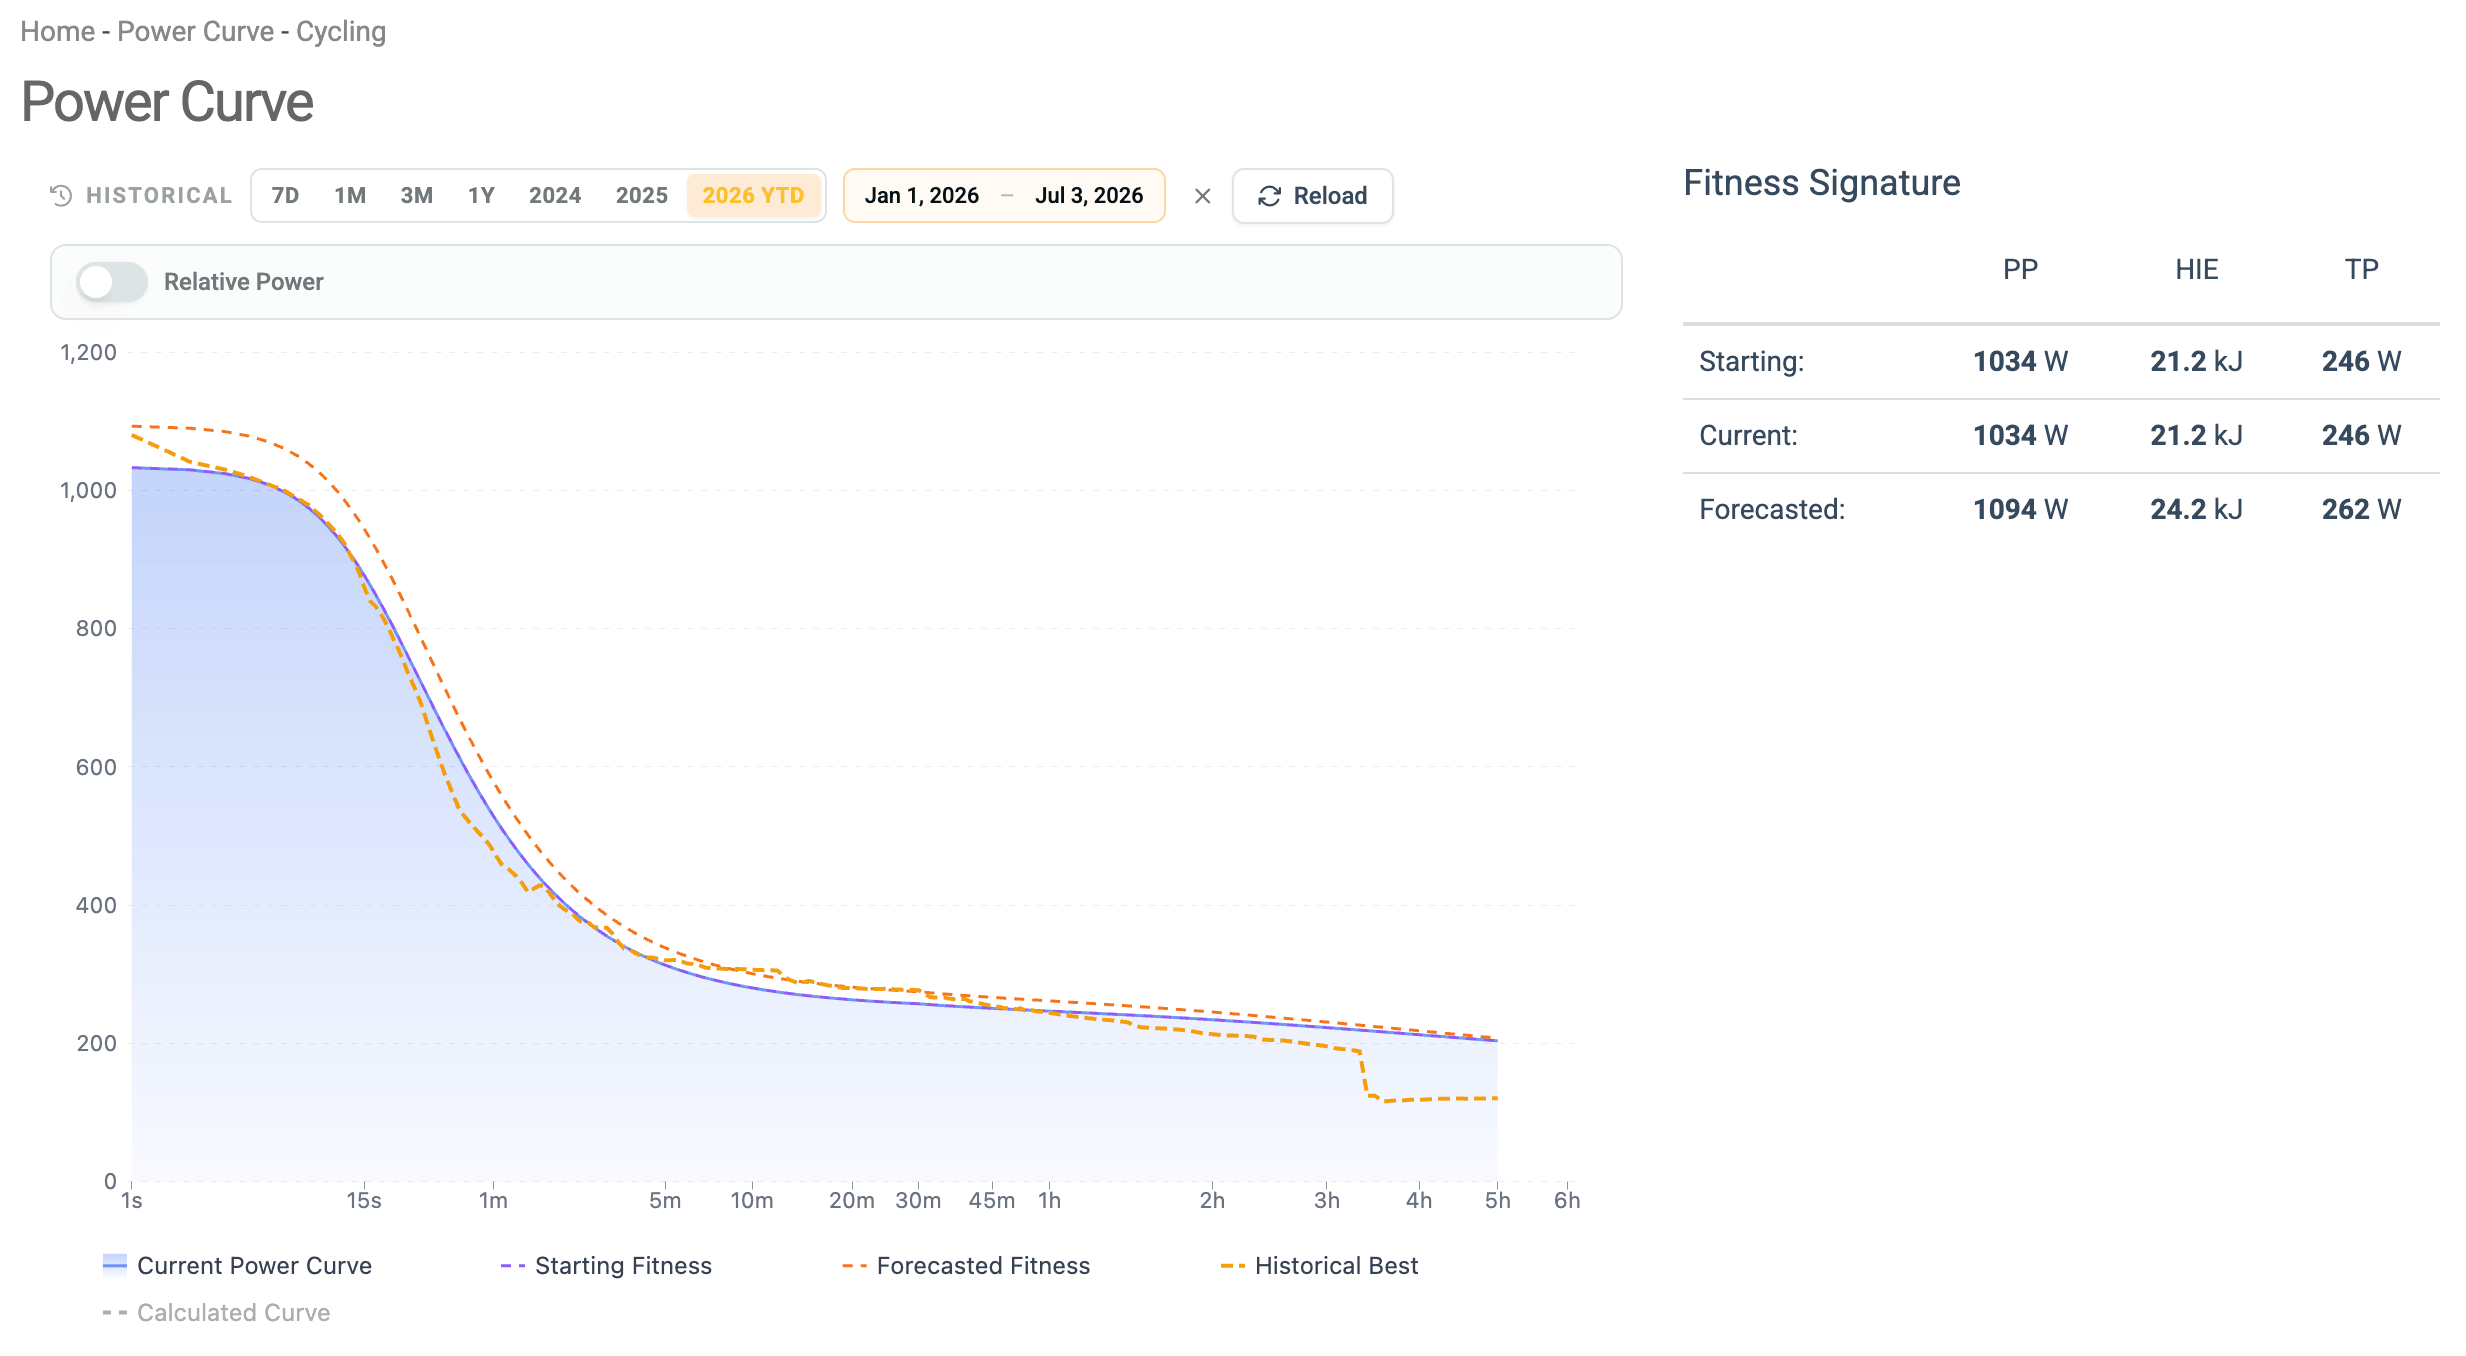
The Xert Power Curve represents your modeled fresh-to-failure performance across durations. It's calculated from your Fitness Signature and visualizes your maximum sustainable power at each duration. Your Power Curve reflects the combined behavior of your three energy systems:
- Peak Power (PP)
- High-Intensity Energy (HIE)
- Threshold Power (TP)
In Xert, your Fitness Signature defines your Power Curve.
Note: Many of Xert’s SMART workouts use your Power Curve to determine interval intensity. For example, an interval prescribed as 5 MMP means the effort should be performed at your modeled 5-min Mean Maximal Power (MMP). As your Fitness Signature changes over time, these interval targets automatically update - ensuring your workouts remain aligned with your current fitness level throughout the season.
How Xert Calculates the Power Curve
Xert models your Power Curve using MPA (Maximum Power Available). For any steady power output, Xert calculates how long you could sustain it — modeling how quickly your MPA would decline at that power, until MPA reaches the power itself and you can't continue.
This lets Xert determine:
- The duration you can sustain a given power output, or conversely
- The power you can sustain for a given duration
Importantly this can be done as your MPA decreases & recovers throughout your rides!
Historical Power Curve (MMP Overlay)
Some platforms build a power curve using Mean Maximal Power (MMP) - the highest average power you've actually produced over each duration in real rides. Xert's Power Curve, in contrast, is modeled from your Fitness Signature rather than relying solely on historical bests.
You can overlay your historical MMP data on top of your signature-derived Power Curve by selecting a time range (7D, 1M, 3M, 1Y, or a specific year) and clicking Load.
Depending on how your current fitness compares to your historical fitness, your MMP overlay may appear:
- Below your signature-derived curve — expected in most cases, since most real-world/field data aren't fresh-to-failure efforts
- Above your signature-derived curve — possible if your signature is currently underestimating your fitness, or if you were fitter at some point during the selected time window than you are currently
For more on why your recorded bests are often lower than your modeled Power Curve, see FAQ: Why Is My Xert Power Curve Higher Than My Recorded Bests?
Where You'll See It
- On the Power Curve page
- Under the Power Duration tab in Activity Details
Common Misunderstandings
- The Power Curve is not just historical bests. It's a model of what Xert thinks is theoretically possible given your unique fitness signature.
- It assumes fresh-to-failure efforts. Most rides aren't fresh-to-failure, so your recorded MMP won't usually reach the modeled Power Curve - even at durations where you're strong.
Related Terms
- Fitness Signature
- Maximum Power Available (MPA)
- Breakthrough & Near-Breakthrough
- Mean Maximal Power (MMP)
- Focus Duration & Type
Comments
0 comments
Please sign in to leave a comment.